
Cluster empty state redesign
I worked on the Cloud Growth team which focused on product-led growth by launching experiments to test assumptions and find new ways to improve metrics. Although some of these experiments were small changes to the product, it had major impact on the product metrics.
For this project, I redesigned the empty state for the Cluster page. The new design was A/B tested against the previous design to see if there were any improvements toward helping users get data running through their system.
Highlights: In this projects, I explored many options, focused on visual design, worked quickly for A/B testing and iterations, and created something with major impact on the business and design system.
Background
When users don’t have any data running through their system, they encounter blank empty states. To take advantage of this space, we decided to show in-product prompts to emphasize they don’t have any data running yet and provide clear set of guided options on what they could do about it.
The prompts serve to guide new users through the onboarding process so that they can quickly get onboarded with Confluent Cloud.
Hypothesis: Expect to increase the number of users who achieve onboarding and production activation as well as decrease the amount of time that it takes for customers to achieve activation (data running through their system)
Goal
Guide inactive and new users on how to get data running through their system
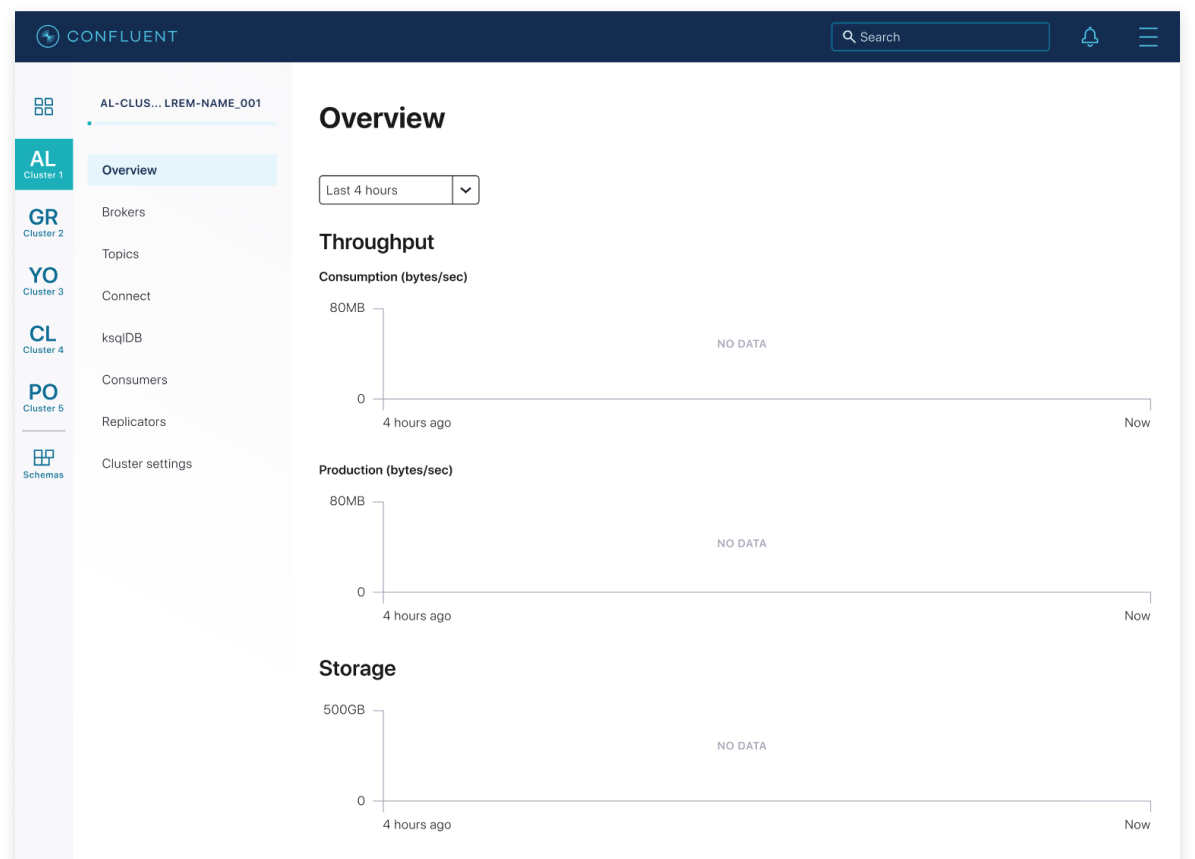
Before
The previous empty state didn’t provide any information on why the charts for this page were all empty. As you can see, this page is not very useful - especially for a new user.
Explorations
I explored many options for this design and received feedback from the design team as well as stakeholders.
Based on feedback, I opted for a design that was eye catching, showed clear next steps, and helped users understand what is normally supposed to show on the page when they go there.
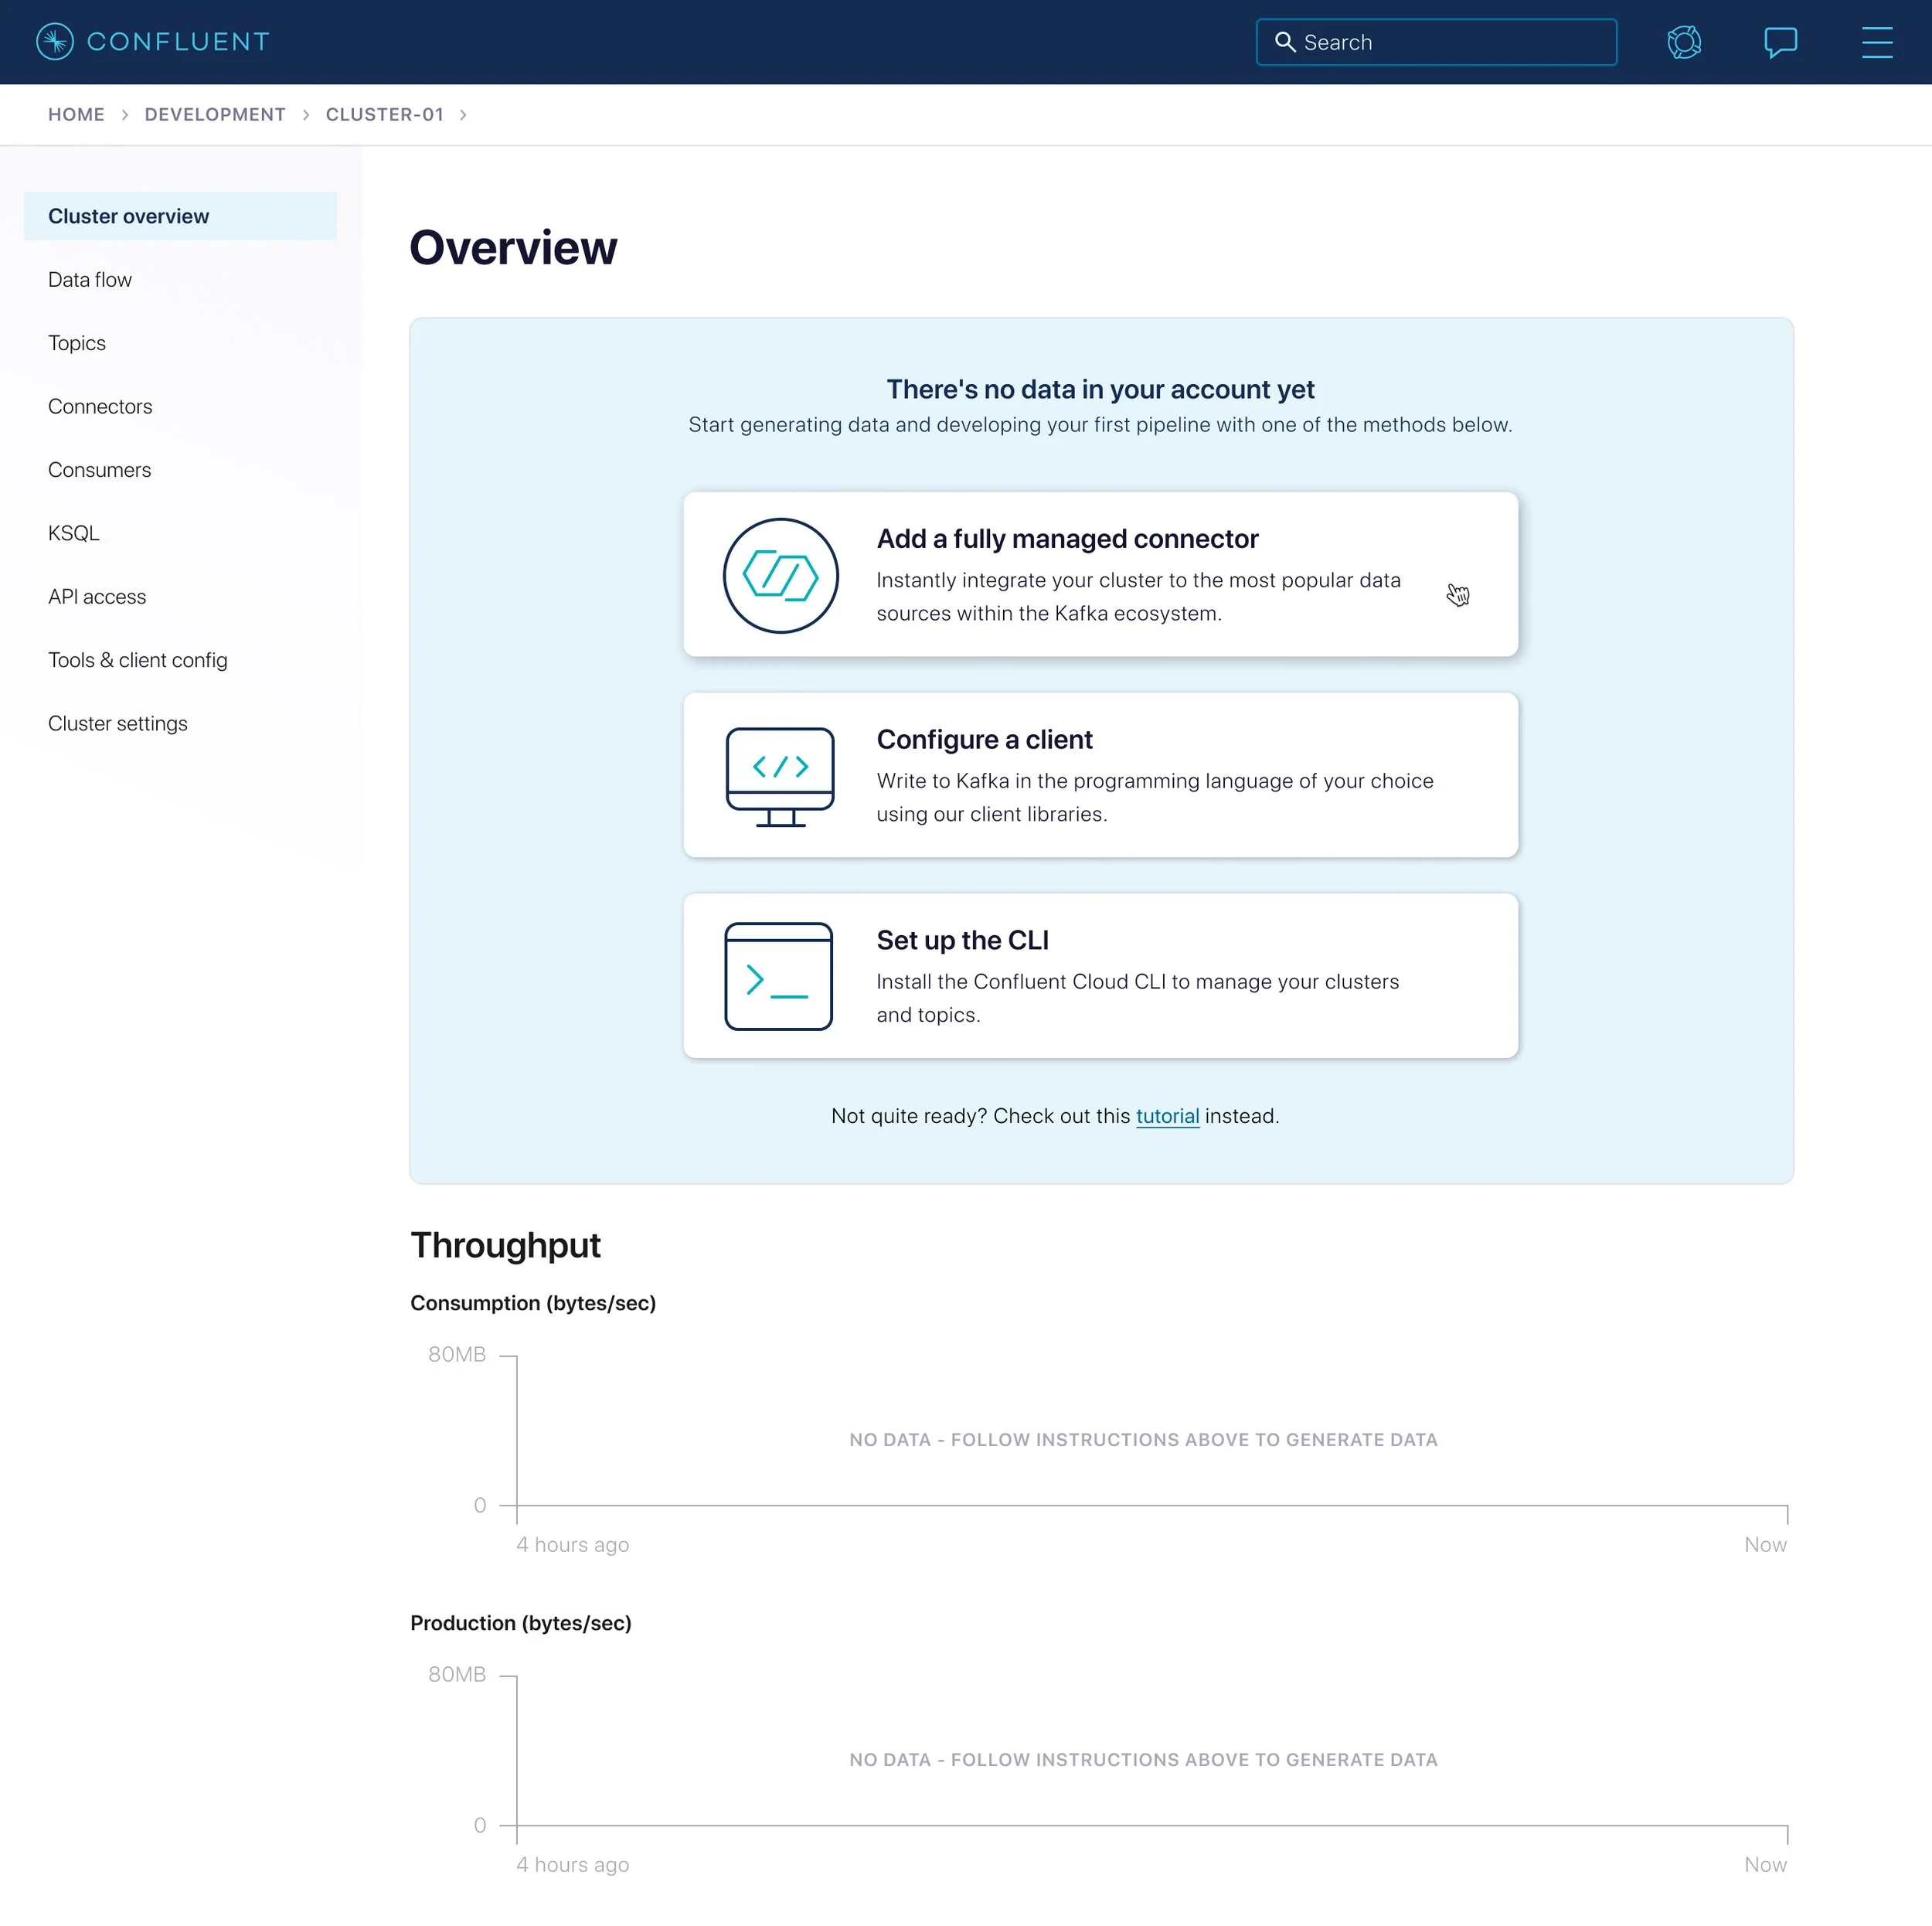
Final design
Impact:
This design was tested against the previous design. From A/B testing:
Increased number of orgs from inactive to active by 6%
Increased number of orgs from onboarding to active by 11%
Onboarding users were 2x more likely to achieve production activation in the first 14 days
Due to the success from the A/B test, this update was made permanent in product.
This design pattern was adopted for many more empty states across the product
Design rationale:
I experimented with modals and full screen prompts. Ultimately we decided it was still important for users to see the bottom metrics, even if there was nothing in it, so they could learn what to expect from this page in the future. We decided against the modal so they could still navigate around the product.
We opted for a bolder color background to alert users that they do not have any data running in their system.